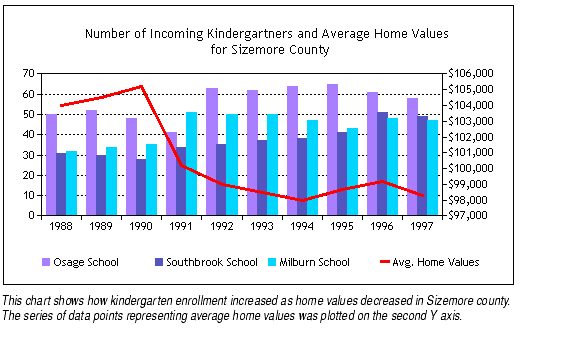
Combination charts let you display different types of data in different ways on the same chart. You may display columns, lines, areas, and steps all on the same combination chart. Use them to visually highlight the differences between different sets of data.

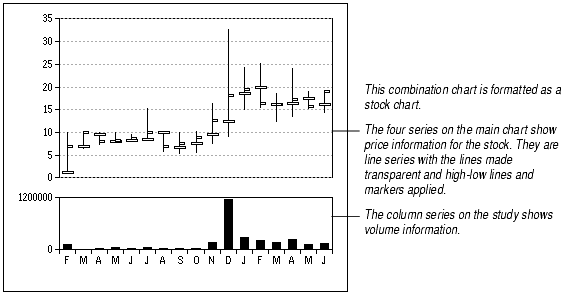
Combination charts are a good choice if you want to make a chart with a study that shows data in a different way than the main chart. For example, the main chart below is a line chart showing stock information, while the study is a column chart showing volume of trading.

You create a combination chart just as you would any other chart: Select a data range, click the chart button, and draw the chart on the worksheet. For instructions, see Creating a Chart.
Next, change the chart type to Combination in the Chart Type dialog. For instructions, see Changing the Chart Type.
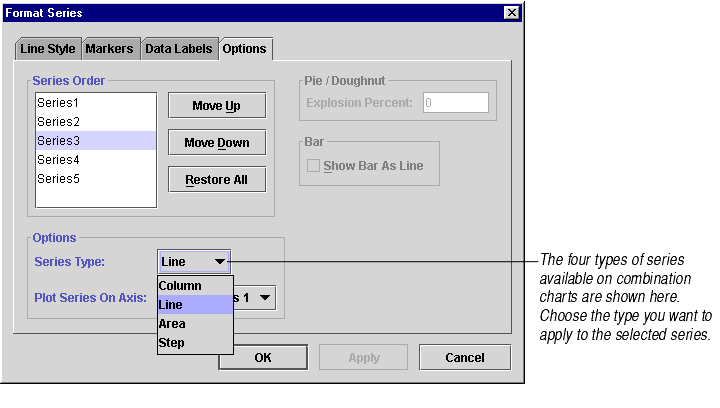
After you change the chart type, the chart looks like the default column chart you had before, with all the data points displayed as columns. This is because column is the default type for displaying data on combination charts. You have to tell Formula One for Java which types of charts you want to combine on the chart. You do this by selecting a chart type for each series on the chart.
To select a chart type for a combination chart series:

Hidden data points. Depending on the chart's data, it's possible to inadvertently hide some or all of the data points of one series behind another series. You can fix this problem in several ways:
Formatting options. The different chart types available on combination charts each have their own characteristics and possibilities. For information, see the documentation on individual chart types: About Area Charts, About Column and Bar Charts, About Line Charts, and About Step Charts.
