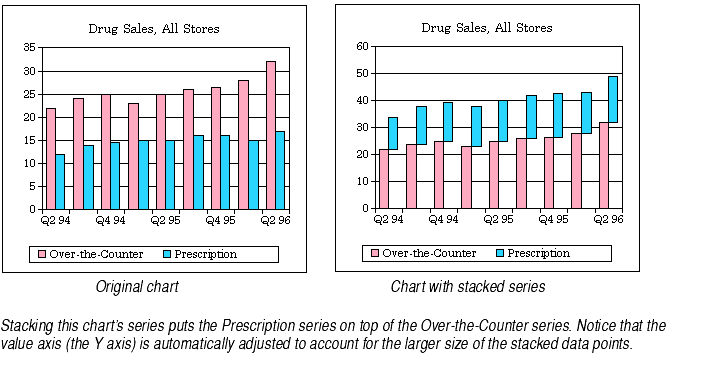
For area, bar, column, line, and step charts, by default each series of data is plotted starting from the X axis. This means the data points are shown on an equal footing with each other, each its own distance from the X axis.
You may choose to stack series one on top of the other, so that the data points from one series are arranged on top of the data points of another series. Stacking is useful if you want to show each data point's contribution to the total of all the data points in a category.

To stack series:
Stacking bar and column charts. By default, stacked series on bar and column charts are offset from one another, as shown in the example above. To line up all the stacked series one on top of the other, change the plot's Bar Gap Ratio to -100. For information on Bar Gap Ratio, see Setting Bar Spacing Options.
Stacking line charts. Since data points on line charts are not visually linked to the X axis, stacking series on line charts should be done with care to avoid misleading the viewer. For more information, see Special Notes About Line Charts.
Preset value axes. When you stack series, Formula One for Java automatically adjusts the chart's value axis, as shown above. However, if you have previously adjusted the value axis scale so that it is no longer automatically scaled, the settings you chose for that axis remain. If the Maximum value you set is not large enough to accommodate the now-stacked data points, some of them may go off the chart. For more information on scaling value axes, see About Axis Scale.
Applies to all series and studies. When you stack series, you have to stack all of the series on a chart. You may not stack some series and leave others un-stacked. This also applies to charts with studies and second Y axes: If you stack the series on the main chart, multiple series displayed on the same study will be stacked as well.
