About Stock Charts
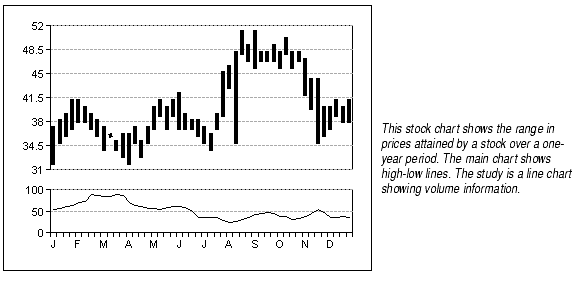
Stock charts show stock market data. There are many variations on stock charts, but most show the range of prices attained by a stock over a length of time. Stock charts often include studies that indicate the volume of trading over the same length of time.

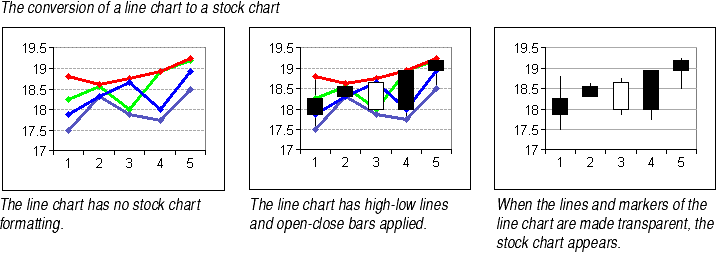
Stock charts differ from the other chart types in that there is no chart type for stock charts. You can't choose Stock from the Chart Type dialog. Instead, you create a line or column chart and apply stock chart formats to make the line or column chart display the stock market information appropriately.

Types of Stock Charts

|
High-Low Charts show the high and low price a stock attained for a particular period of time. The chart displays a series of vertical lines where the top of the line shows the high price, the bottom of the line the low price. For information, see Creating High-Low Charts. |

|
Open-High-Low-Close Charts show the high and low price a stock attained for a particular period of time as well as the opening and closing prices of the stock for the same period. The chart shows the same type of vertical lines displayed on a high-low chart. The opening and closing prices can be shown in two ways: by markers on the line, or by open-close bars superimposed on the high-low lines. For information, see Creating Open-High-Low-Close Charts. |

|
Volume Charts show the volume of trading, and often appear as studies below the main chart. Volume charts can be simple line charts, column charts, column charts in which the columns appear as lines, or line charts showing drop lines. For information, see Creating Volume Charts. |
Creating High-Low Charts
To create a high-low chart:
- Create the chart's data range containing the high and low prices. While the data range can have any shape, it's best to make one column of high prices and an adjacent column of low prices.
- Select the data range and create the chart, as explained in Creating a Chart.
- Change the chart type to Line, as explained in Changing the Chart Type.
- Add the high-low bars, as explained in Adding High-Low Lines to Line Charts.
- Select the first series and make the series line transparent, as explained in Changing Line Styles and Colors. Do the same with the other series.
After you have the high-low formatting in place, you may make any other formatting changes to the chart that you would like. For information on your options, see Adding High-Low Lines to Line Charts.
Creating Open-High-Low-Close Charts
To create an open-high-low-close chart:
- Create the chart's data range containing the open, high, low, and close prices. While the data range can have any shape, you will have to make the fewest formatting changes if you enter open prices in the first column, high prices in the second column, low prices in the third column, and close prices in the fourth column. (See note below.)
- Select the data range and create the chart, as explained in Creating a Chart.
- Change the chart type to Line, as explained in Changing the Chart Type.
- Add the high-low bars, as explained in Adding High-Low Lines to Line Charts.
- If you want to mark the opening and closing prices with open-close bars, add open-close bars as explained in Adding Open-Close Bars to Line Charts.
- If you want to mark the opening and closing prices with markers, select the series displaying the open prices and apply the marker style of your choice to it, as explained in About Markers. Do the same to add markers to the series displaying the close prices.
- Select the first series and make the series line transparent, as explained in Changing Line Styles and Colors. Do the same with the other three series.
After you have the open-high-low-close formatting in place, you may make any other formatting changes to the chart that you would like. For information on your options, see Adding High-Low Lines to Line Charts.
Note Open-close bars will display properly only if the series of data points representing the open and close are the first and last series on the chart. If your data range is not set up like this, you can change the order of the chart series in the Options tab of the Format Series dialog. For more information, see Changing the Order of Chart Series.
Creating Volume Charts
Since volume charts come in many forms, there is no one set method for creating them. The following guidelines should help you create your own volume charts.
- Volume charts as studies. Most volume charts appear as a study below the main chart. The basic procedure for creating studies is to enter the volume information in the chart's data range, then assign the series that represents the volume numbers to the study axis. For more information, see About Studies.
- Chart types for volume studies. When the volume chart is a study, you may want to display its data points in a different format than the main chart. For example, you may want the main chart to be a line chart displaying high-low lines while the study shows volume information in columns. To do this, change the chart type to Combination, then assign the different series to different chart types. For more information, see About Combination Charts.
- Volume charts showing lines. Creating volume charts showing lines is exactly the same as creating any other line chart. For information, see About Line Charts.
- Volume charts showing bars. Creating volume charts showing bars is exactly the same as creating any other column chart. For information, see About Column and Bar Charts.
- An especially useful feature of column charts when used as volume charts is the Show Bar As Line option, which lets you make extremely narrow bars. For information, see Showing Bars as Lines.


