Creating a Chart
To create a chart:
- Select the cells on the worksheet that contain the data you want to chart. These cells are called the data range. It may contain numbers and headings. Headings must appear in the top row and/or the left column of the selection. These headings will automatically appear as labels on the chart.

- For more information about the data range, see Working With Chart Data Ranges.
- Select Insert > Chart or click the Chart button:

- Draw the chart onto the worksheet by clicking and dragging from the chart's upper left corner to its lower right corner, as if you were drawing a rectangle. You can change the chart's size and position later.
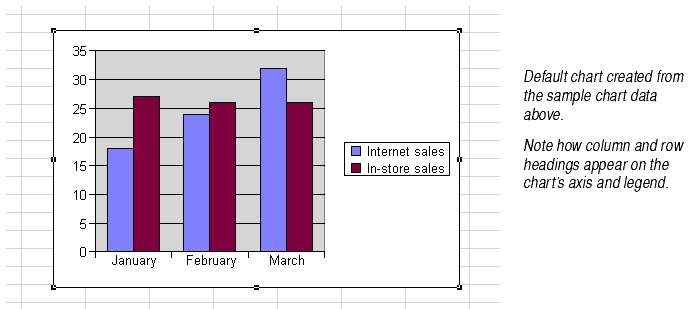
- Formula One for Java creates a column chart that shows the data you selected. The column chart is the default chart type; you can change it later. The chart's legend appears at the right side.


