You can change the styles, colors, and widths of the lines, such as axes and grid lines, that appear on charts. You can also change the colors and widths of lines that are drawn around chart elements like the title and the legend.
The first step in changing line styles and colors is deciding which lines you want to change.
| To change the style or color of... | Select... | Choose menu option... | Choose tab... |
|---|---|---|---|
| Axis | the axis | Format Axis | Line Style |
| Chart outline | anything | Format Chart | Line Style |
| Data label outline | the data label(s) | Format Data Labels | Line Style |
| Data point outline | the data point(s) | Format Data Point | Line Style |
| Drop lines | the drop lines | Format Drop Lines | Line Style |
| High-low lines | the high-low lines | Format High-Low Lines | Line Style |
| Legend outline | anything | Format Legend | Line Style |
| Major grid lines | the major grid lines | Format Grid Lines | Line Style |
| Minor grid lines | the minor grid lines | Format Grid Lines | Line Style |
| Open-close bars | the open or close bars | Format Open-Close Bars | Line Style |
| Plot outline | anything | Format Plot | Line Style |
| Title outline | anything | Format Title | Line Style |
For information on selecting chart elements, see Selecting Chart Elements.
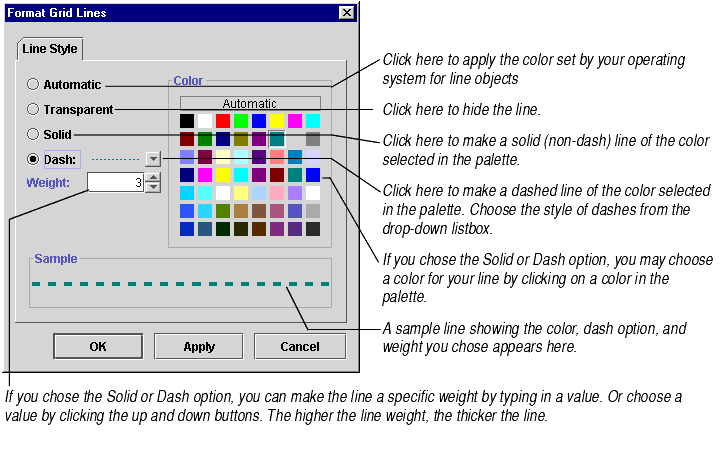
The Line Style tab, shown below, lets you change the width, style, and color of the line(s) you selected.

When you finish making changes, click Apply to see your changes or OK to accept your changes.
