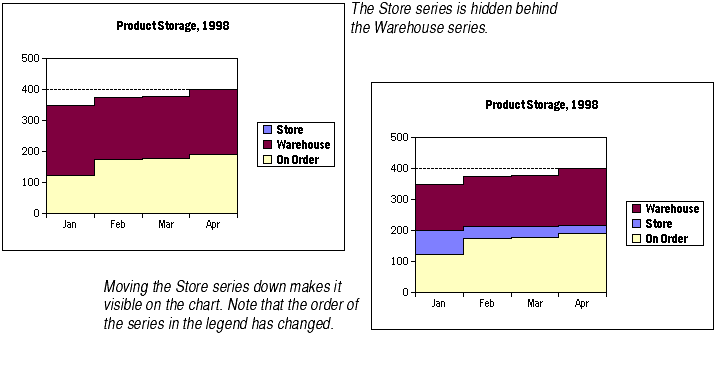
By default, charts display series in the order in which the series appear in the chart's data range. Sometimes that order becomes inappropriate once the data is plotted on the chart, especially in area and step charts, where the first series can block the display of later series.
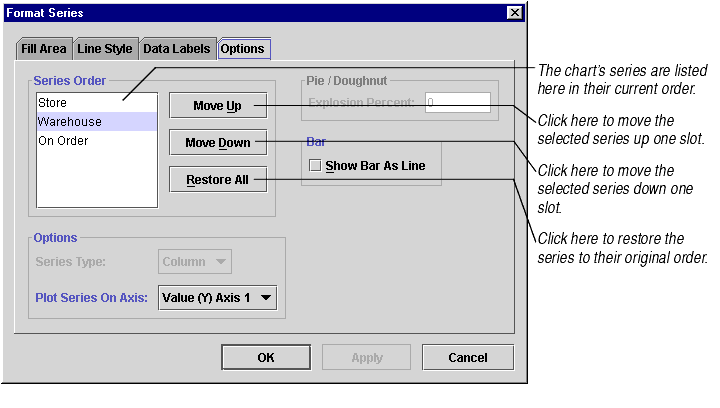
To fix this problem, you may change the order of the series. Changing the series order also changes the order in which the legend displays the series names.

A series plotted on a study will stay on that study even when you change the order of that series.
Note You may also display hidden series by stacking them or displaying them as percentages of the category total. For information on stacking, see Stacking Series of Data Points. For information on displaying series as percentages, see Plotting Data Points as Percentages of the Category.
To change the order of series on a chart:

