Voltage Clamp Measurement of Electroporation Current
In 1786 Luigi Galvani supposedly was performing experiments with a machine
in the company of friends, when, by chance, one member of the party idly
probed with a knife the nerves of the thigh of a skinned frog to be used
for soup. As the muscles of the frog leg suddenly and unexpectedly
contracted, Galvani's wife noted that a spark had been produced by the
electrical machine and "fancied that there was an agreement in point of
time."
-Encyclopedia Britannica
Specific Aim:
The increase in transmembrane current in the presence of an external
electric field
and its relaxation following the removal of the field are caused by
changes in pore population. Thus, transmembrane current under an applied
field can be used to estimate the factors related to pore population and
dynamics. When a cell is placed in an electric field, both
transmembrane current and transmembrane potential change dynamically. However,
one unknown can be removed from the measurement process by holding the
transmembrane potential constant during the measurement of transmembrane
current. Thus, transmembrane current will be measured using a voltage
clamp technique over a range of transmembrane potentials. Pore creation
rate dependence on transmembrane potential will be estimated from these
measurements for use in the proposed model.
Experimental Methods and Materials:
A series of membrane electroporation current measurements will be
performed using the voltage clamp technique. These measurements will be used to determine the relation between
transmembrane potential and transmembrane current. The voltage clamp
technique involves clamping a constant voltage across a cell membrane and
simultaneously measuring the transmembrane current. This makes it possible
to calculate changes in membrane conductance during the pulse.
Voltage Clamp Configuration: An improved double vaseline
gap voltage clamp (Chen and Lee, 1994) will be used to measure transmembrane
current as a function of transmembrane potential (Fig. 8). The experimental chamber
will be divided into three partitions. The middle partition, central pool
(CP),
will be 300  m in width while each adjacent partition, end pool (EP), will
be 100
  m wide. An isolated muscle cell will be mounted in the notches
of the two partitions. The cell will be held in place, spanning the central
pool, by two Delrin clips attached to the bottom of the two end pools using
high vacuum grade stop-cock grease. Thin vaseline seals and two glass cover
slips will be used to electrically isolate the three pools from each other.
The two end pools are electrically connected and are constrained by a command
pulse (V). The command pulse is used in a feedback mechanism to adjust the
injected current (I) to maintain or clamp the transmembrane potential at a
prescribed level.
Measurement Protocol: A Total Clamp 8800 (Dagan Co.,
Minneapolis, MN) will be used in all the voltage clamp measurements. The
control commands will be transmitted by an IBM personal computer-based
digital-to-analog converter. The shape,
magnitude and duration of the electrical pulses will be specified using
a software interface. The transmembrane current will be filtered at 3kHz
by an electronic filter (902LPF) and digitized by a digital oscilloscope
(Tektronix 11401, Beaverton, OR). Measurements will be made for a series of
4 to 800 msec pulses clamping the membrane at potentials ranging from -140 to
-400 mV.


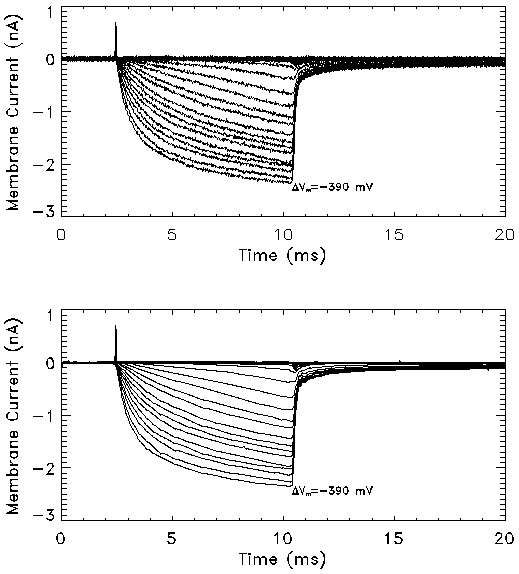
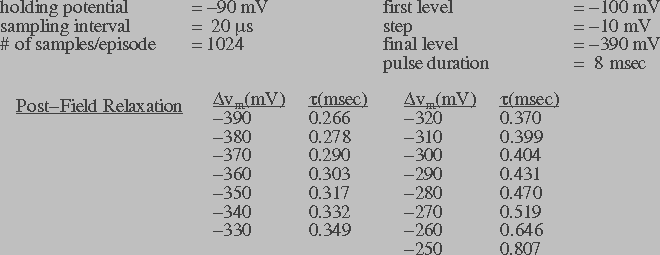
Figure 5a: Transmembrane current in response to a series of
square pulses of 8 msec duration measured using the voltage clamp
setup. The transmembrane potential in these experiments ranged from
-100 mV to -390 mV in steps of -10 mV. The membrane current profiles
(bottom) were obtained from the raw data (top) by noise removal using
the wavelet shrinkage method. The post-field data was fit to an
exponential function to obtain the relaxation time constant (t).
Preliminary Studies:
The objective of voltage clamp studies was to measure transmembrane current under
constant transmembrane potentials and to incorporate these measurements into the
theoretical model. Transmembrane current under a constant transmembrane
potential was measured (Fig. 5a,Fig. 5b) using a double vaseline gap voltage
clamp technique (Chen and Lee, 1994). This technique has the advantage
that the transmembrane potential can be maintained at a constant value without
significant spatial variations. In addition, using channel blockers and
substituting certain ions, the transmembrane current can be isolated to
electroporation current.


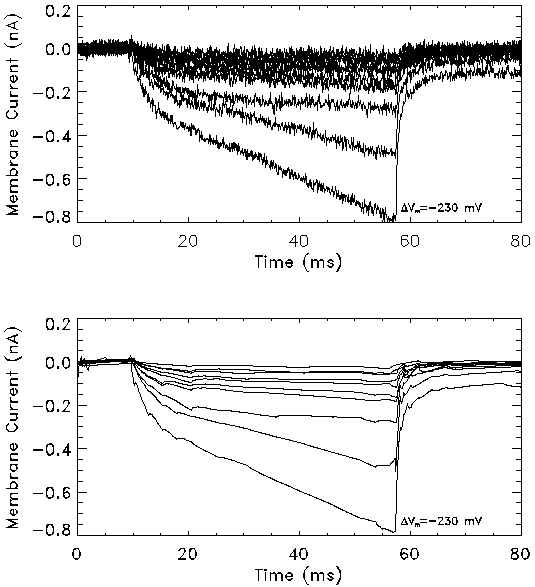
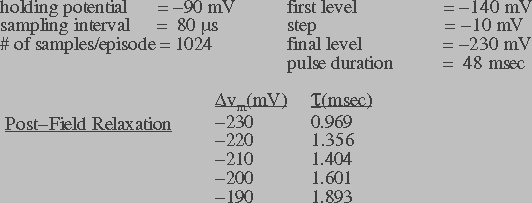
Figure 5b: Transmembrane current in response to a series of
square pulses of 48 msec duration measured using the voltage clamp
setup. The transmembrane potential in these experiments ranged from
-140 mV to -230 mV in steps of -10 mV. The membrane current profiles
(bottom) were obtained from the raw data (top) by noise removal using
the wavelet shrinkage method. The post-field data was fit to an
exponential function to obtain the relaxation time constant ( ).
).
Single muscle cells from the semitendinosus of the English frog rana
temperoria were used in these measurements. The spacing between the clamps
holding the cell was 300  m, which is small compared to the space constant of the cell
thus ensuring relatively uniform transmembrane potential along the length of
the cut-cell. The cell was held at -90 mV holding potential prior to
applying the stimulation pulses. Figure 5a shows a time profile of the
transmembrane current in response to different transmembrane potential
pulses. A series of 8 msec pulses in the range of -100 to -390 mV were
used to study the evolution of transmembrane current during the pulse
and relaxation following the pulse. The wavelet shrinkage method of
noise removal (Donoho and Johnstone, 1992) was used in extracting the
signal (Fig. 5a,Fig. 5bbottom) from the measured data (Fig. 5a,Fig. 5btop).
Briefly, the signal was recovered by a three-step process.
The wavelet transform of the recorded data was computed, a soft
threshold was applied on the resulting wavelet coefficients and
finally, the inverse wavelet transform was computed to obtain the
restored signal.
The results of Fig. 5a indicate that the current did not reach
steady-state within 8 msec in the range of potentials studied. Thus,
longer pulses at smaller pulse amplitudes were studied. Figure 5b
shows the transmembrane current profiles in response to 48-msec pulses in
the range of -140 to -230 mV. It is seen that only small amplitude
pulses (<200 mV) show steady-state behavior. Results for transmembrane
potentials higher than 200 mV indicate that the balance between pore
expansion and contraction is not reached within the pulse duration.
Longer transmembrane potential pulses are required to measure the
steady-state response of transmembrane current. Figures 5a and 5b
also list the post-field relaxation time constant ( ) for
different transmembrane potentials. The relaxation time constant
information will be used in the theoretical model to estimate the
pore destruction rate.
 m in width while each adjacent partition, end pool (EP), will
be 100
  m wide. An isolated muscle cell will be mounted in the notches
of the two partitions. The cell will be held in place, spanning the central
pool, by two Delrin clips attached to the bottom of the two end pools using
high vacuum grade stop-cock grease. Thin vaseline seals and two glass cover
slips will be used to electrically isolate the three pools from each other.
The two end pools are electrically connected and are constrained by a command
pulse (V). The command pulse is used in a feedback mechanism to adjust the
injected current (I) to maintain or clamp the transmembrane potential at a
prescribed level.


 ).
).