You can change the color that fills many different chart elements. You can also fill chart elements with a two-color pattern or with a gradient, an effect in which one color fades into another color.
The first step in changing a chart element's fill color, pattern, or gradient is to decide which chart element's fill color you want to change.
| To change the fill color, pattern, or gradient of... | Select... | Choose menu option... | Choose tab... |
|---|---|---|---|
| Chart | anything | Format Chart | Fill Area |
| Data label(s) | the data label(s) | Format Data Labels | Fill Area |
| A data point | the data point | Format Data Point | Fill Area |
| A series of data points | the series | Format Series | Fill Area |
| Legend | anything | Format Legend | Fill Area |
| Open-close bars | the open or close bars | Format Open-Close Bars | Fill Area |
| Plot | anything | Format Plot | Fill Area |
| Title | anything | Format Title | Fill Area |
For information on selecting chart elements, see Selecting Chart Elements. For information on changing fill colors for markers, see About Markers.
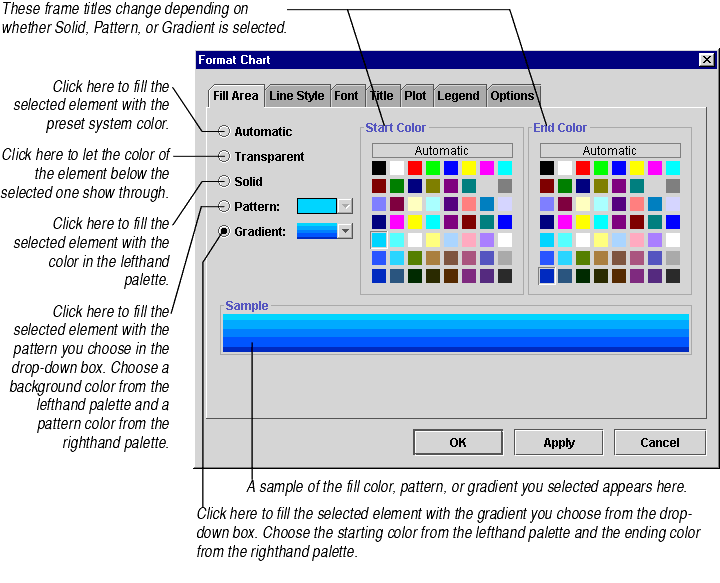
The Fill Area tab, shown below, lets you change the color that fills the chart element(s) you selected. It also lets you fill that element with a pattern or a gradient.

When you finish making changes, click Apply to see your changes or OK to accept your changes.
