Markers are small symbols that appear directly on top of data points in line and XY charts and on line series in combination charts. You cannot display markers on any other chart types. Markers are often used on stock charts to show the stock's opening and closing prices.

You can choose from 10 different styles of markers. The styles are:

|
Circle | 
|
Square |

|
Diamond | 
|
Standard Deviation |

|
Dow Jones | 
|
Star |

|
Down Triangle | 
|
Triangle |

|
Plus | 
|
X |
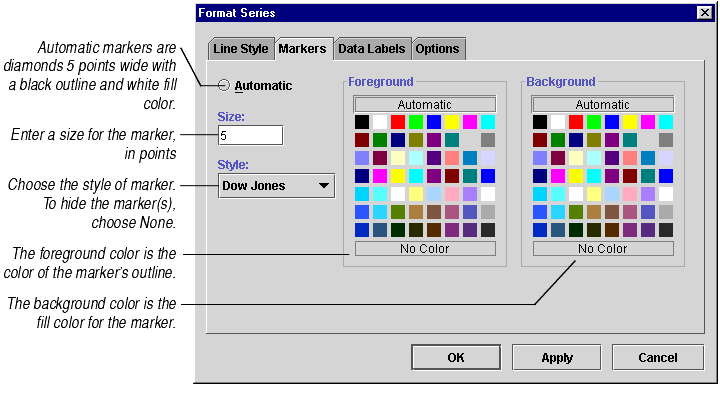
You can display or hide markers. You can choose the style, size, and background and foreground colors of displayed markers.
The first step in editing a marker is to decide which marker(s) you want to edit.
| To edit... | Select... | Choose menu option... | Choose tab... |
|---|---|---|---|
| One marker | the data point | Format Data Point | Markers |
| All markers for a series of data points | the series | Format Series | Markers |
For information on selecting data points and series, see Selecting Chart Elements.
The Markers tab, shown below, lets you edit markers.

When you are finished editing markers, press Apply to see your changes or OK to accept your changes.
