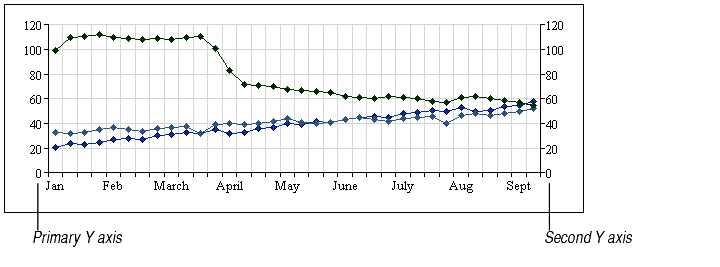
A second Y axis is a Y axis drawn on the right-hand side of a chart. It can show the same axis scale as the primary Y axis or a different scale.
You can use a second Y axis with the same scale as the primary Y axis on a wide chart to help viewers interpret the data more easily.

You can use a second Y axis with a different scale than the primary Y axis to plot a series of data on a different scale. This lets you compare two dissimilar series of data on the same chart without overemphasizing the importance of the larger series.
To create a second Y axis, you indicate which series should appear on the second Y axis. The second Y axis appears automatically.
To plot a series on a second Y axis and automatically create the second Y axis:
A problem with plotting different series on different Y axes is that the chart itself doesn't indicate which series corresponds to which Y axis. This can be quite confusing because the viewer can't immediately identify the values of individual data points.

To help alleviate this problem, try any or all of the following:
