Temperature Modulated Raman Spectrometer
2.131 Advanced Measurement and Instrumentation
Prof. Ian Hunter - Spring 2019
2.131 Advanced Measurement and Instrumentation is a graduate class taught by Prof. Ian Hunter that provides training in advanced instrumentation and measurement techniques. Topics include system level design, fabrication and evaluation with emphasis on systems involving concepts and technology from mechanics, optics, electronics, chemistry and biology.
In this class, along with the Gluco ID team, we built a temperature modulated Raman spectrometer for non-invasive material characterization using the system identification techniques taught in the class.
The Raman Spectrometer
Along with the Gluco ID team, we developed a full-scale temperature modulated Raman spectrometer leveraging system identification to increase the SNR by reducing the fluorescense background. We succesfully used it to identify a diamond sample.
Setup of the Raman Spectrometer
Optical SetupOptical Setup
Temperature-tunned laser for system identification
Temperature-tunned LaserTemperature-tunned Laser
Spectral measurements
Spectral measurementsSpectral measurements
System identification techniques for noise reduction
System IdentificationSystem Identification
Optical Setup
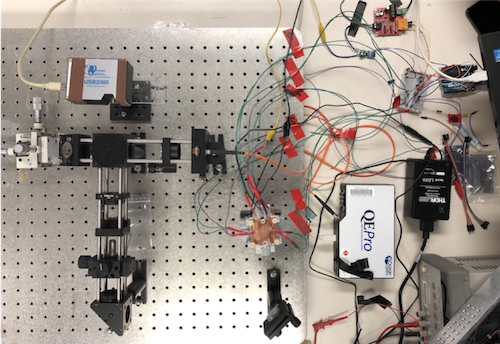
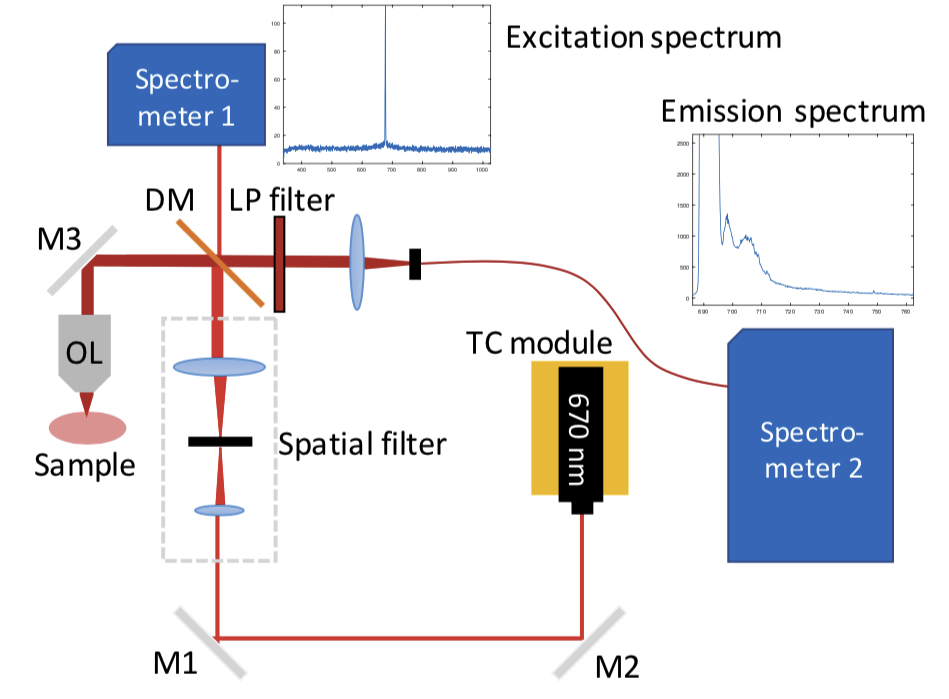
In order to accurately measure the Raman spectrums with shifted excitation wavelengths, we built a confocal Raman microscope with a temperature control module which can shift the wavelength of the excitation laser. A 670 nm laser diode (CPS670F, 4.5 mW, Thorlabs) was installed in a customized temperature control module as the excitation light source. The output beam was directed through a spatial filter (C260TMD-B, Thorlabs; P25D, Thorlabs) using two mirrors, and was then collimated through a 50 mm focal-length lens (LBF254-050-B, Thorlabs) to a beam diameter of approximately 10 mm. The expanded beam then hit a 685 nm long pass dichroic mirror (FF685-Di02-25x36, Semrock), where the majority of the light was reflected and focused at the sample through an objective lens (CFI Apo NIR 40X W, 0.8NA, Nikon). The transmitted light (less than 1%) was collected by a spectrometer (USB2000, Ocean Optics). The focused incident light excited the sample and generated both long-shifted fluorescent and Raman emissions, which were effectively collected by the same objective lens. The collected emission light then passed the dichroic mirror and were cleaned up by a premium 685 nm long pass filter (FF01-685/LP-25, Semrock). Finally, the emission photons were coupled into a high-sensitive spectrometer (QE Pro, Ocean Optics) via a 40 mm focal-length lens (LBF254-040-B, Thorlabs) and a 25 m diameter multimode optical fiber (M68L02, Thorlabs).
The confocal Raman microscope was carefully aligned by Zeguan and Nithin to maximize both the excitation power and signal intensity. Finally, they achieved 1 MW of excitation power was achieved, and the integration time of the spectrometer was to 1-2 s.
Temperature-tunned Laser
The signal-to-noise ratio (SNR) of spontaneous Raman microscopes is typically limited by fluorescent background. Our approach to SNR increase was to make consecutive measurements of the same sample with different excitation wavelengths. Since the flouroscent background is mostly unaffected by the excitation wavelength, the two measurement could be shifted to overlap, such that by taking the difference of the measurements a fraction of the background could be eliminated.
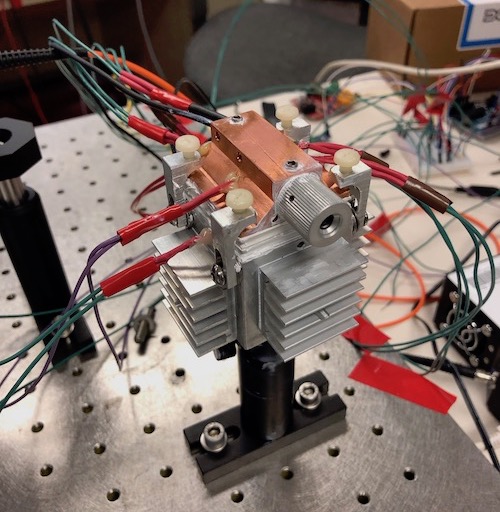
Due to budget contraints, I developed and built a customized temperature control module for our laser source. Alex and I used two stacked Peltier thermoelectric coolers (12V, 90W) in parallel, controlled by a Pulse Width Modulated (PWM) signal from Arduino and driven by an h-bridge from a power supply. The setpoint could range from approximately 15 to 80 degrees Celsius, with temperature fluctuations below one degree.
Spectral Measurements
We tested our system on a diamond sample. After the spectra was taken, Hilary performed the data processing and spectral analysis, which showed that by temperature tunning the laser wavelength, we achieved a 48% increase in SNR.
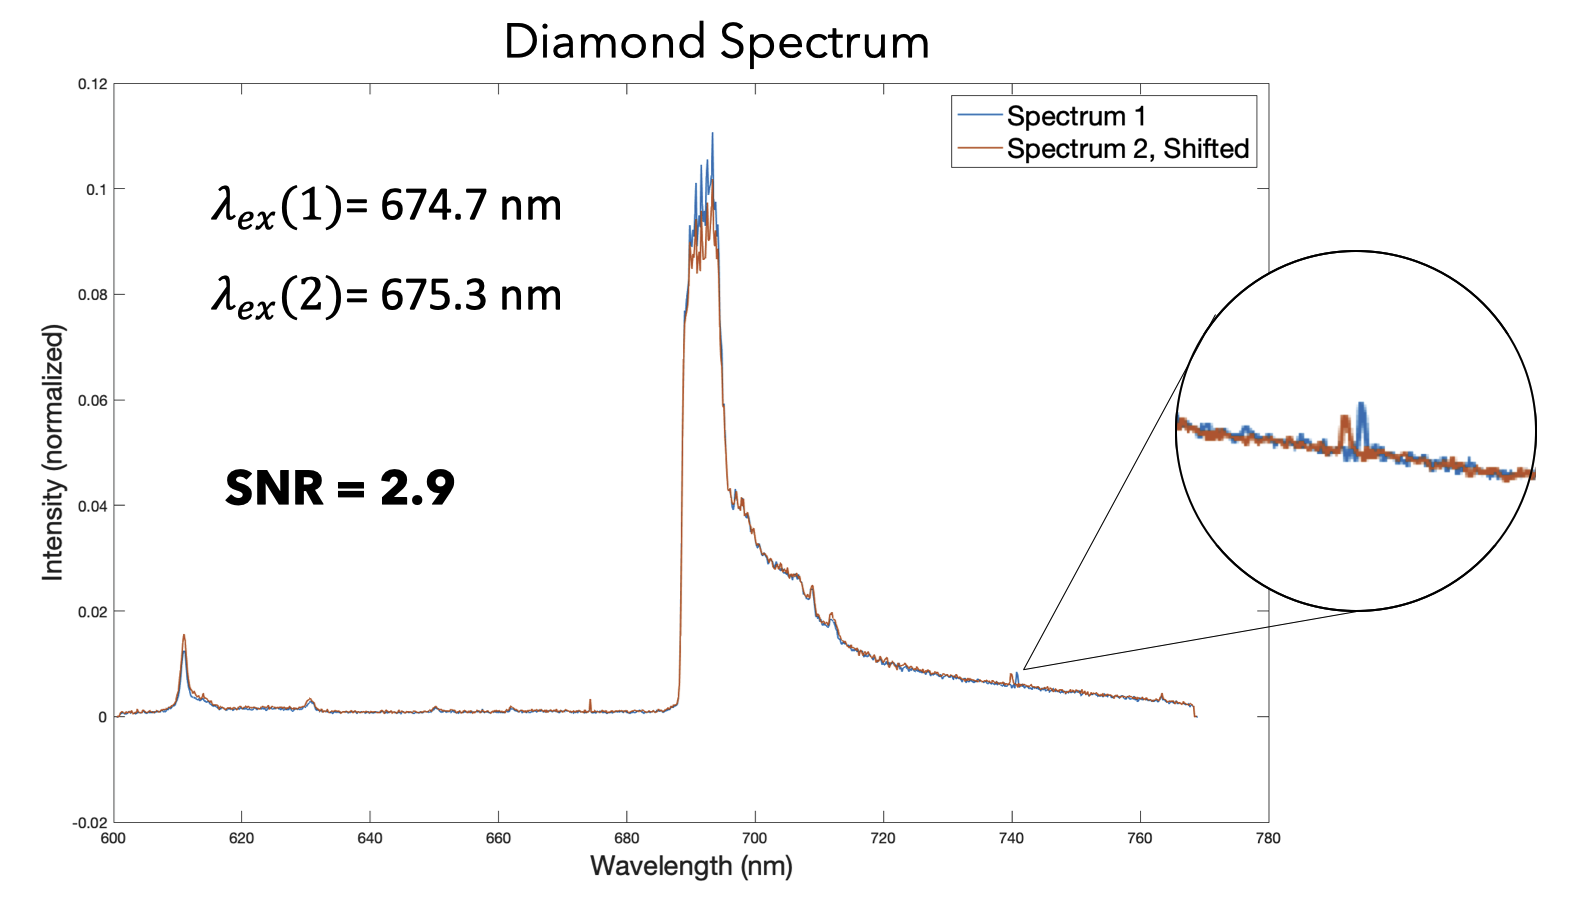
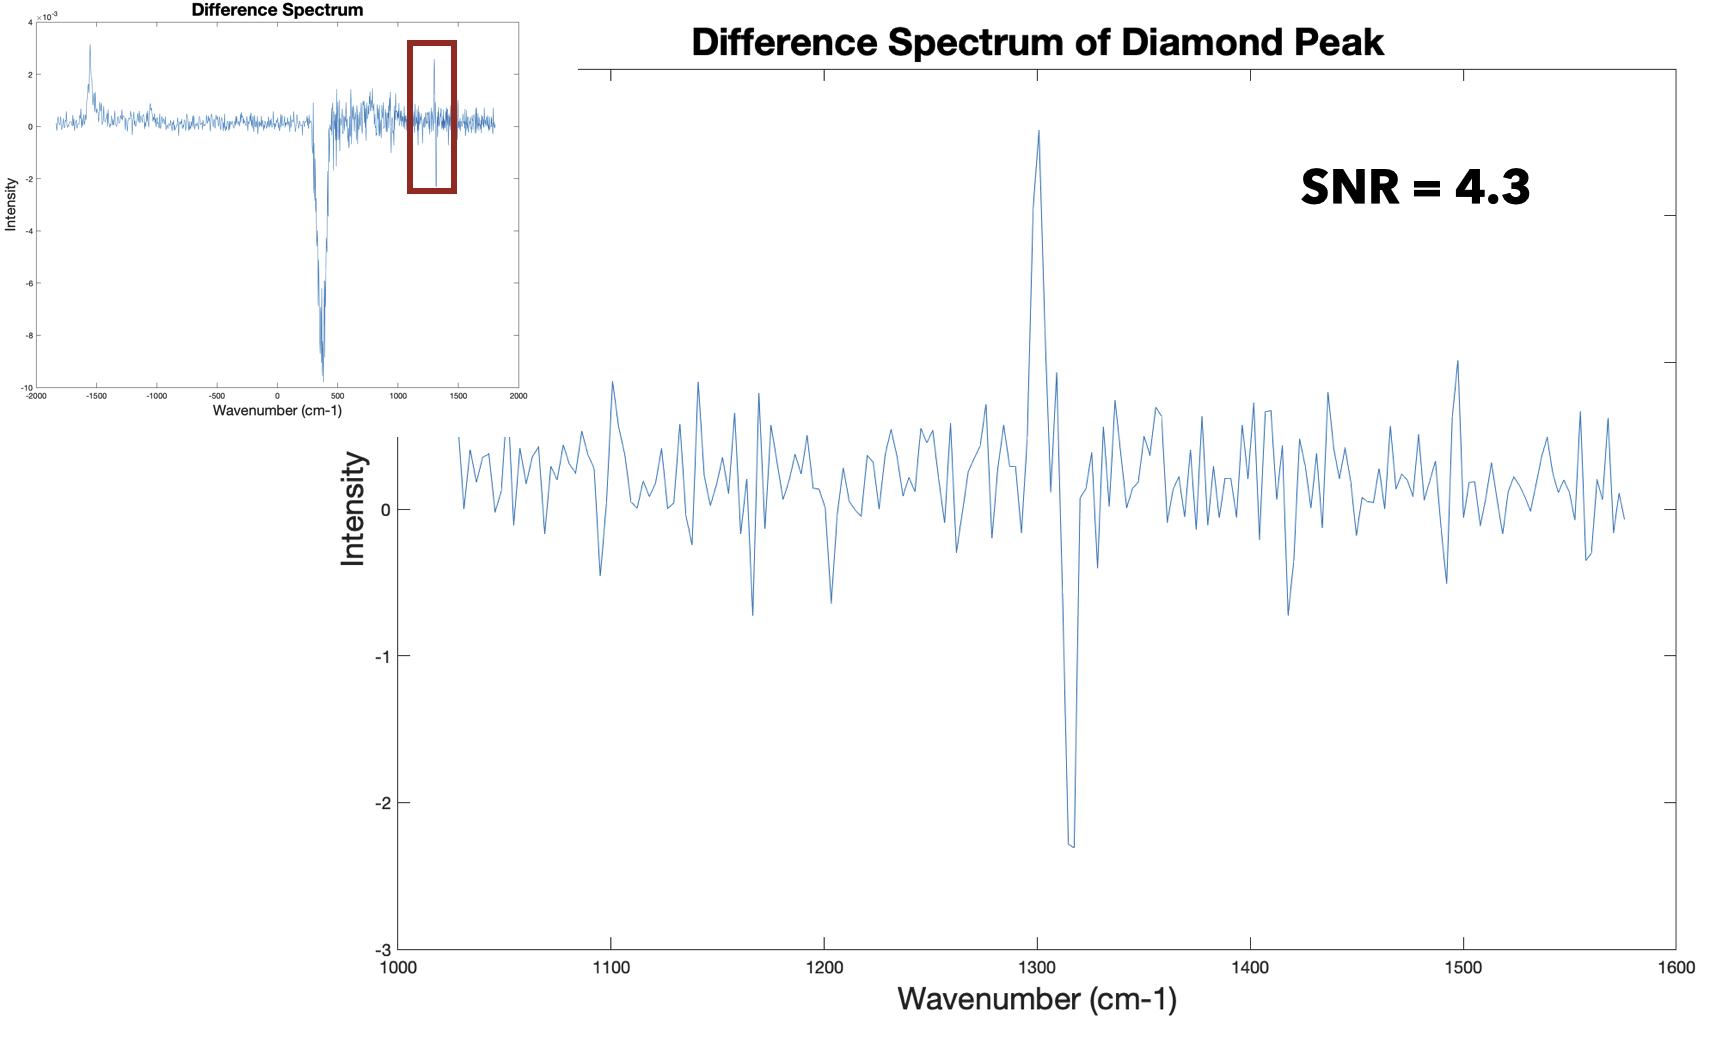
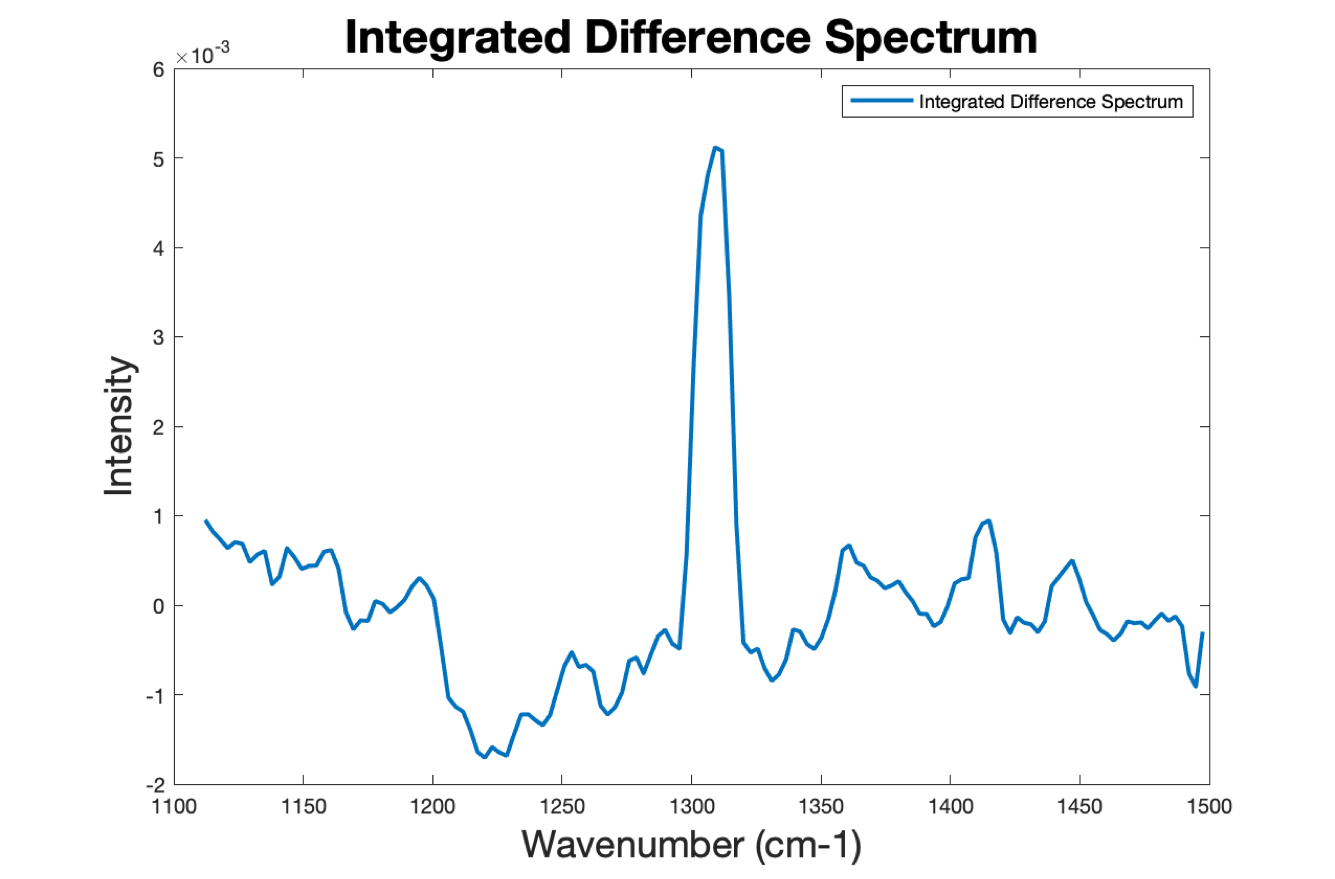
The core of the spectral data processing consists of taking the difference between two shifted spectra to eliminate much of the fluorescent background noise to increase the signal to noise ratio of the Raman signal. The spectra were both normalized based on the integrated intensity of the excitation wavelength to account for variation in laser power over time. The two spectra were subtracted and the result was then integrated to obtain the final spectrum, which resembles published diamond Raman peaks.
System Identification
Our initial setup required two spectrometers, one of which was used for direct measurement of the laser source wavelength. A potential alternative would be to determine que laser wavelength based on some of the other data that readily available from the temperature module. Ideally, we would want to know the transfer function between the PWM signal and the wavelength. However, there are several non-linearities withing the system that make the analytical estimation extremely complex.
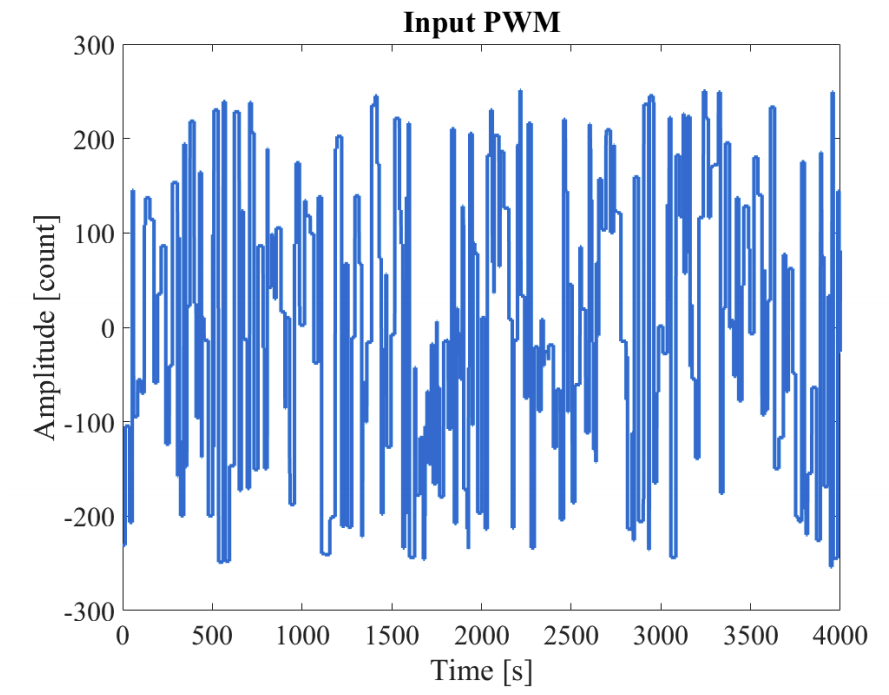
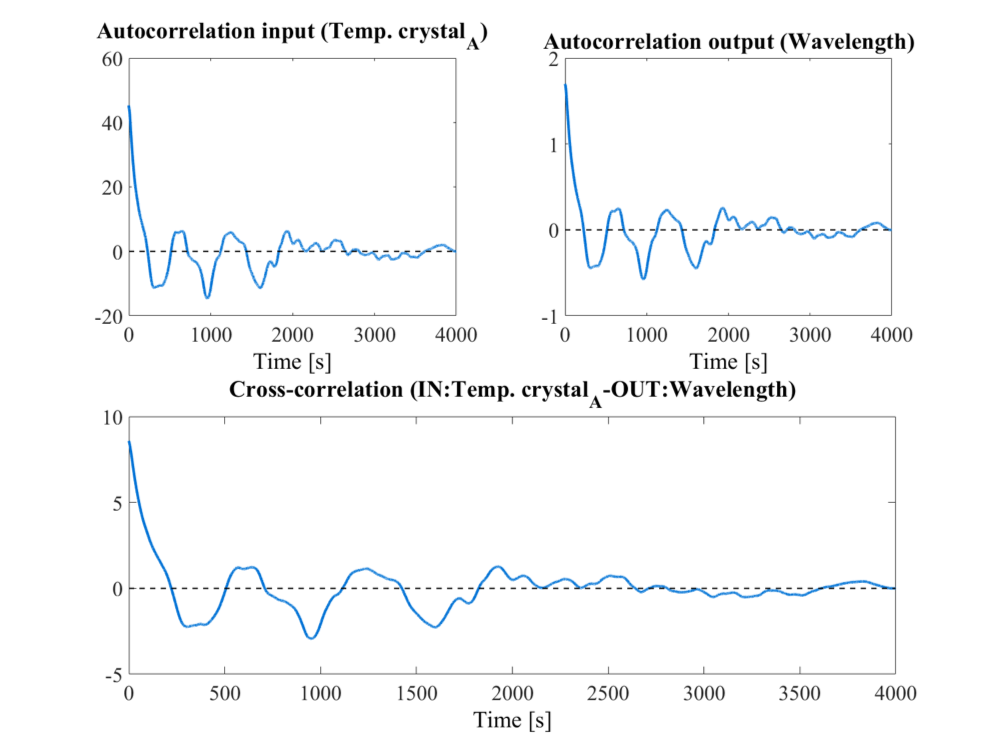
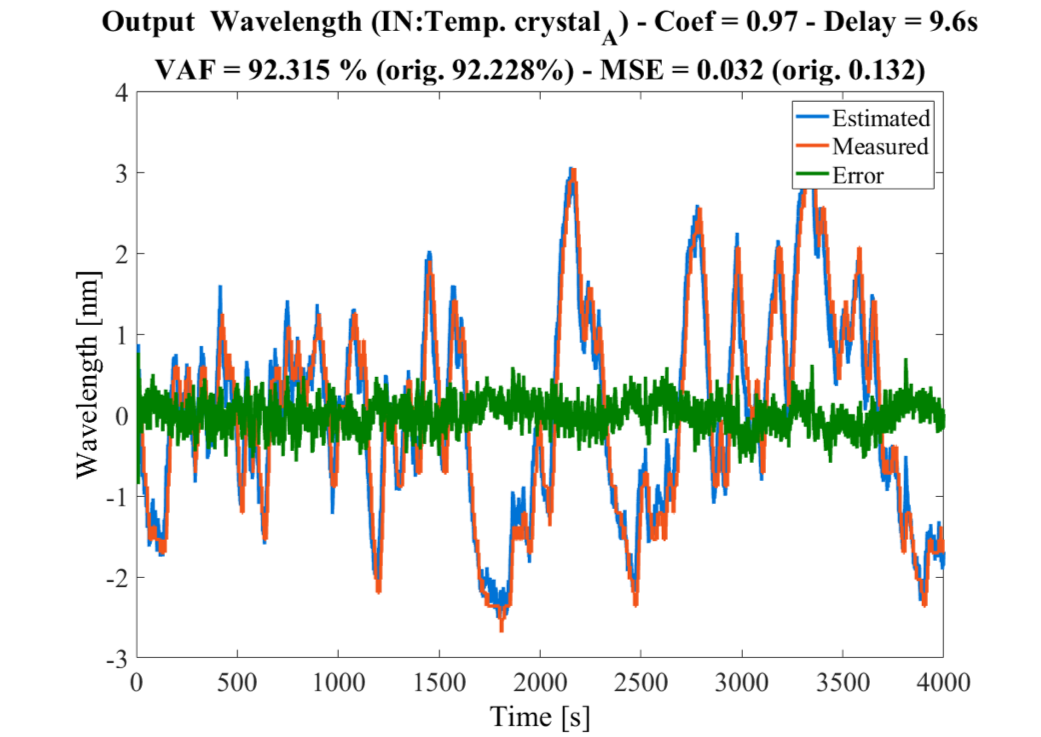
To tackle this problem, I decided to implement the system identification techniques learned in the class to experimentally determine the transfer functions between the multiple readout and the source wavelength. Using a stochastic PWM signal as the input, I estimated the impulse response of the system using the input auto-correlation and input-output cross-correlation. Using the experimentally determined impulse response, the wavelength of the source can be estimated. We performed this analysis for all the input-output combinations and, as expected, we obtained the best results when estimating the wavelength from one of the temperature sensors, with which a Variance Accounted For of 92.3% and a Root Mean Square Error of 0.18 degrees were achieved.
The team
The GLuco ID team was composed by Alexander Urpí, Hilary Johnson, Sai Nithin Redd Kantareddy, Zeguan Wang, and myself.
This project was a reality thanks to the valuable suggestions of Prof.Hunter throughout the project. Also thanks to the help of Span Spanbauer and Michael Zervas.