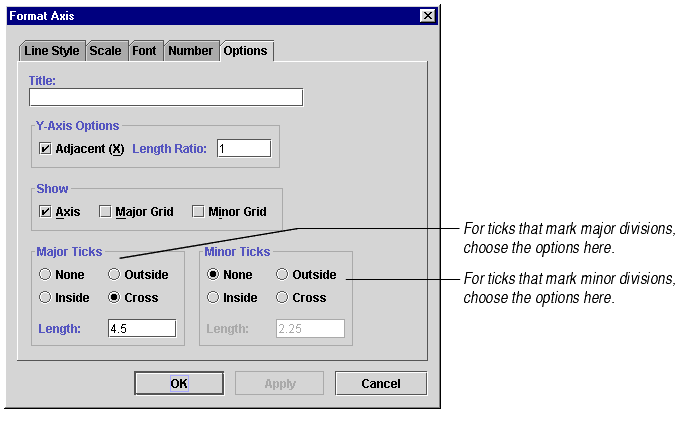
A tick is a short line on an axis. For category axes, ticks separate each category. For value axes, ticks mark the major divisions and show the exact point on an axis that the axis label defines. Ticks are always the same color and line style as the axis.

Ticks come in two types: major and minor.
Major ticks separate the axis into major units. On category axes, major ticks are the only ticks available (you cannot show minor ticks on a category axis). On value axes, one major tick appears for every major axis division.
Minor ticks subdivide the major tick units. They can only appear on value axes. One minor tick appears for every minor axis division.
By default, major ticks appear for value axes. You can show or hide ticks for both value and category axes.
The number of ticks displayed depends on the Major Divisions and Minor Divisions settings in the Scale tab of the Format Axis dialog.
To show, hide, or choose the style of ticks:

Note Since category axes have no minor divisions, they cannot display minor ticks. Checking anything but None in the Minor Ticks frame has no effect on category axes.
