Conversion for data visualization R-Python conversion guide
General structure
Basic plots The main basic plots are summarized in the table below:
| Type | R command | Python command |
| Scatter plot | geom_point( x, y, color, size, fill, alpha ) | sns.scatterplot( x, y, hue, size ) |
| Line plot | geom_line( x, y, color, size, fill, alpha, linetype ) | sns.lineplot( x, y, hue, size ) |
| Bar chart Histogram | geom_bar( x, y, color, size, fill, alpha ) | sns.barplot( x, y, hue ) |
| Box plot | geom_boxplot( x, y, color ) | sns.boxplot( x, y, hue ) |
| Heatmap | geom_tile( x, y, color, fill ) | sns.heatmap( data, cmap, linecolor, linewidth, cbar ) |
Advanced features
Additional elements We can add objects on the plot with the following commands:
| Type | R command | Python command |
| Line | geom_vline( xintercept, linetype ) | ax.axvline( x, ymin, ymax, color, linewidth, linestyle ) |
geom_hline( yintercept, linetype ) | ax.axhline( y, xmin, xmax, color, linewidth, linestyle ) | |
| Rectangle | geom_rect( xmin, xmax, ymin, ymax ) | ax.axvspan( xmin, xmax, ymin, ymax, color, fill, alpha ) |
| Text | geom_text( x, y, label, hjust, vjust ) | ax.text( x, y, s, color ) |
Last touch
Legend The title of legends can be customized to the plot with the following command:
plot + labs(params)
where the params are summarized below:
| Element | R command | Python command |
| Title / subtitle of the plot | title = 'text' | ax.set_title('text', loc, pad) |
subtitle = 'text' | plt.suptitle('text', x, y, size, ha) | |
| Title of the $x$ / $y$ axis | x = 'text' | ax.set_xlabel('text') |
y = 'text' | ax.set_ylabel('text') | |
| Title of the size / color | size = 'text' / color = 'text' | ax.get_legend_handles_labels() |
| Caption of the plot | caption = 'text' | ax.text('text', x, y, fontsize) |
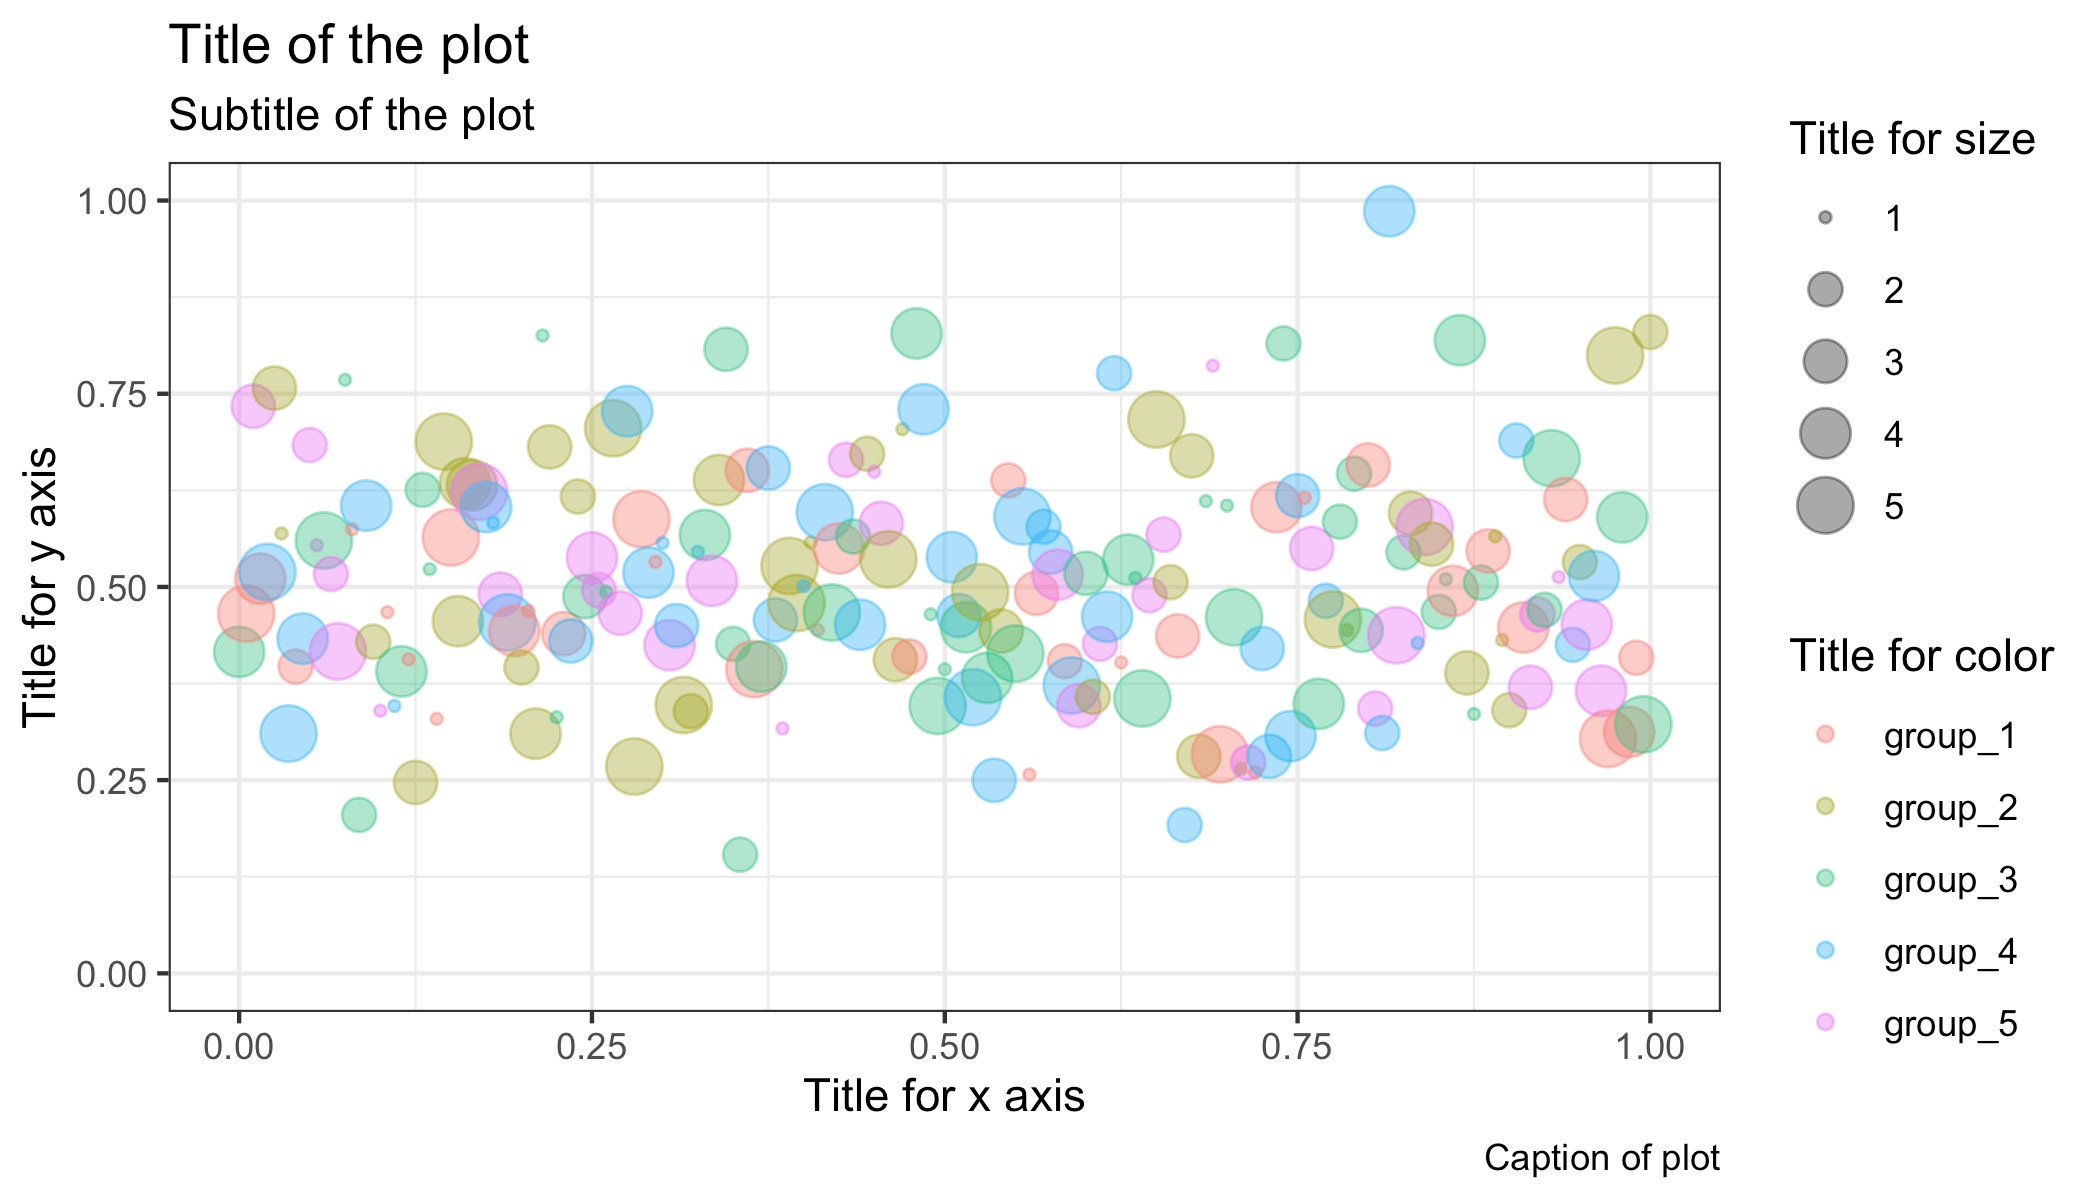
This results in the following plot: