1. Put a light at the top of a vertical stand. Ideally, the light should be the same height as the camera lenses. Put the light at the approximate center of the workspace area. The workspace area is the area visible to both cameras within which the observer's motion will be resricted. In the PC Tracker Utility program select CAMERAS, NEW. Enter the values in the left column, distances in meters, Horizontal and Vertical FOV (field of view) of the cameras in degrees. Select OK, and then save the file with a name you chose. Notice that the name is now shown under the "calibration file" label. You can now use the video tracking system without distortion correction in VRUT by copying this file to the vrut/plugins folder and being sure that it is renamed as "curcal.cal". In order to achieve full and undistorted performance from the video tracking system, you must follow the remainder of the steps.
2. Mark out a grid on the floor in increments that you can easily measure (e.g., -- a grid of lines separated by 1 meter). Put a small marker, such as a piece of tape, at the intersection of each line of the grid.
3. Choose an origin which will be X=0, Z=0, and make a list of the physical (X, Z) coordinates of all the intersections of your grid with virtual North (positive z values) pointed away from the cameras and virtual East (positive x values) pointed to the left of the origin as seen by the cameras. The actual location of the origin is entirely arbitrary and is not critical because it can be reset on-the-fly and made to be any other location. Next, make a list of these coordinates and store it as a text file that has one entry per line and each line has an X and Z coordinate (tab-delimited). Make the order of the coordinates in this list the same order that you will be measuring the computer registered coordinates with your light (e.g., an s pattern)
4. Take the light on a stick to the origin position and click on the zero position button on the tracker utility program. Make sure that no distortion correction file is loaded (as will be the case if you have just made a new calibration file).
5. Now take the light to each intersection on the grid and record the cameras estimate of that position. This can be done with the python script \vrut\python\logfix.py which saves the x,z positions in a text file when you press the space bar so you dont have to write them down.
 6.
Take these 2 lists of numbers, the real coordinates and the measured coordinates,
and modify this matlab script so that it loads these two files appropriately.
6.
Take these 2 lists of numbers, the real coordinates and the measured coordinates,
and modify this matlab script so that it loads these two files appropriately.
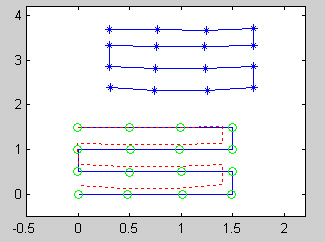
7. Run the script and it will plot the measured data (shown in the figure with the star symbols; also shown as dashed red lines), the real data (shown as blue lines separate from the measured data), and finally the measured data with the distortion correction applied (shown as green circles). The sample figure shown here illustrates a common type of distortion (pin-cushion) as evidenced by the bending of the horizontal lines. The corrected data shows that much of this distortion has been eliminated (notice how the dashed red-lines deviate largely from the green circles). This script also generates a new file called "fit.txt", which will be a 2 by 11 matrix of floating-point numbers representing the least-squares bi-cubic fit of the measured data to the real data. With a text editor add these two rows of numbers to the calibration file you just made on the PC (step 1). The calibration file should now have three rows of numbers. The final calibration file must be called "curcal.cal" and stored in the vrut\plugins folder.
8. Verify that the distortion correction seems to be working correctly (maybe by walking the grid and looking at the PC display. If you walk in a square path, the display should show a square track.
