The first step in changing fonts, font styles, and font colors is to select the chart element that contains the text you want to change.
| To change fonts for... | Select... | Choose menu option... | Choose tab... |
|---|---|---|---|
| Axis labels | the axis | Format Axis | Font |
| Axis titles | the axis | Format Axis | Font |
| Chart title | anything | Title | Font |
| Data label (individual) | the data label | Format Data Labels | Font |
| Data labels (for a series) | the series | Format Data Labels | Font |
| Legend | anything | Legend | Font |
Please note that the axis title and axis labels share the same font characteristics. You cannot make the axis title a different color, size, or font than the axis labels.
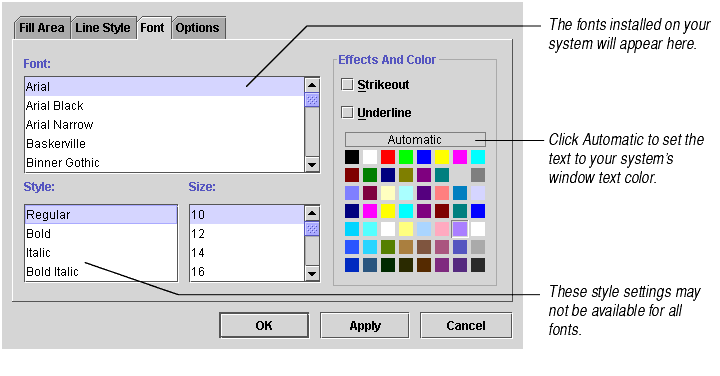
The Font tab, shown below, lets you change the font and its style, size, and color. It also lets you add strikeout bars and underlines.

When you finish working with the Font tab, click OK to accept the changes or Cancel to cancel out your changes.
To set font characteristics for all the text that will appear in the chart (all titles, all labels, and the legend), select the Format Chart menu option and click the Font tab. The tab will appear as shown above. Make your changes and click OK.
Caution The font settings you create in the Font tab of the Format Chart dialog apply to all text in the chart. Font settings on the Format Chart dialog will override any font settings you previously made to individual chart parts.
