About Axis Intersection
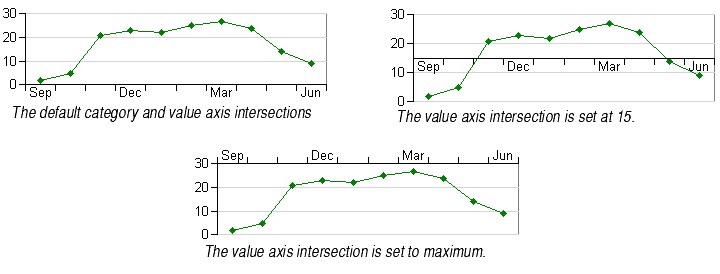
The two axes on a chart must intersect. By default, category axes intersect to the left of the first category, and value axes intersect at 0. If 0 does not appear on the value axis, it will intersect at the value closest to 0.
You may choose to change the intersection in order to change the emphasis on certain chart values. Or you may want to change the intersection if you reversed the order of the axis categories or values and you don't like the resulting change in the axis location.
You can change the axis intersection in a variety of ways:
- You can choose the value at which you want a value axis to intersect.
- You can choose the category at which you want a category axis to intersect.
- You can make an axis intersect at its maximum category or value.

To enter the value at which the value axis will intersect:
- Select the axis.
- Choose Format Axis from the context menu and click the Scale tab.
- In the Intersection frame, un-check the Automatic box to enable the Crosses At text box. Then enter the value in the Crosses At box.
- Make sure the Adjacent axis intersects at maximum value check box is unchecked.
- Click OK or Apply.
To choose the category at which the category axis will intersect:
- Select the axis.
- Choose Format Axis from the context menu and click the Scale tab.
- In the Intersection/Frequency frame, enter a value in the Adjacent axis crosses at category number text box corresponding to the category to the left of which you want the axis to intersect. If your chart has four categories, enter 2 to place the axis intersection between the first two categories.
- Make sure the Adjacent axis intersects at maximum category check box is unchecked.
- Click OK or Apply.
To make an axis intersect at its maximum category or value:
- Select the axis.
- Choose Format Axis from the context menu and click the Scale tab.
- For category axes, check the Adjacent axis intersects at maximum category checkbox. For value axes, check the Adjacent axis intersects at maximum value check box.
- Click OK or Apply.
Axis Intersection's Effect on Axis Labels
When you change the axis intersection of a chart to make the axes appear within the chart plot, the axis labels appear within the chart plot as well.
For vertical axes, axis labels will always appear to the left of the axis, except when the axis intersects at the maximum value, in which case they will be outside of the plot area on the right of the axis.
For horizontal axes, axis labels will always appear below the axis, except when the axis intersects at the maximum value, in which case they will be outside of the plot area, above the axis.


