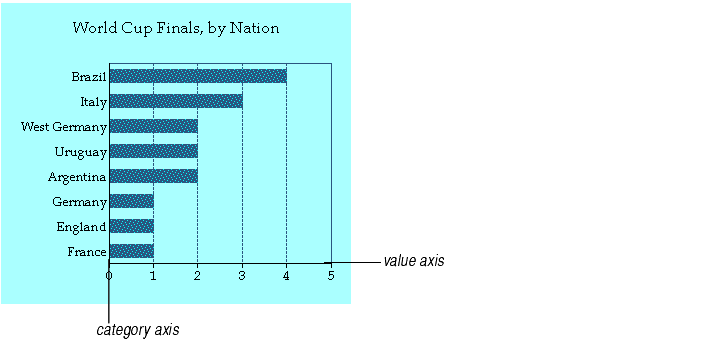
All Formula One for Java charts except pie and doughnut charts have axes. Axes provide a fixed reference that let you compare different data points on the chart. Axes come in two types: category and value.

Category axes show the names of the chart's categories. Labels showing the category names appear between ticks.
Value axes show numbers against which the data points are plotted. Labels showing the values appear for major axis divisions.
A chart may have a value and a category axis or two category axes. The table below shows the axis types assigned to each chart type and their horizontal or vertical orientation.
| Chart type | Horizontal Axis | Vertical Axis |
|---|---|---|
| Column | Category | Value |
| Line | Category | Value |
| Area | Category | Value |
| Step | Category | Value |
| Bar | Value | Category |
| Combination | Category | Value |
| XY (Scatter) | Value | Value |
| Bubble | Value | Value |
