Description Computes multiple exponential regression for a group of observations relative to a number of independent variables. Also optionally computes statistics related to the regression.
This type of regression is often applied to growth situations. Because of the type of formula and the often limited amount of data the formula is based on, using these formulas to estimate values outside of the range of data is dangerous, since they are likely to give exponentially wrong results.
Another problematic aspect of this function is that it assumes the range of data in question fits an exponential model. While this assumption is appropriate in some situations (for example, radioactive decay), in many other situations it is misleading, particularly in regards to economic data.
Note This is an array function. For information, see Array Functions.
Syntax LOGEST(known_y's [, known_x's] [, constant] [, statistics]
| Argument | Description |
|---|---|
| known_y's | A list of observed values for the dependent variable. This must be a range reference or an array constant containing all numeric values and no empty cells. For a regression with a single independent variable, enter any type of range. For a regression with multiple independent variables, enter a single row or column of values. If you are using array constants, see Array Constants in Arguments for information on how to enter the array. |
| [known_x's] | Optional. A list of observed values for the independent variable(s). This must be a range reference or an array constant containing all numeric values and no empty cells. For a regression with a single independent variable, when known_y's is a single row or column, enter a range that exactly matches the size and shape of the known_y's range. When known_y's is more than one row and column, known_x's must be a range containing the same number of values as the known_y's range, although the two ranges may be different shapes. For a regression with multiple independent variables, when known_y's is a single row, enter a contiguous row of values for each independent variable, The number of columns must match the number of columns in known_y's. Similarly, when known_y's is a single column, enter a contiguous column of values for each independent variable, ensuring that the number of rows matches known_y's. If you are using array constants, see Array Constants in Arguments for information on how to enter the array. To fit the regression to a formula that uses polynomials, see "Polynomials," below. When you omit this argument, the function assumes a single independent variable of the sequence {1, 2, 3, ...}. |
| [new_x's] | Optional. A list of values for the independent variable(s) that will compute the results of this function. This must be a range reference or an array constant containing all numeric values and no empty cells. You may enter any number of values in new_x's. The shape of the range only matters if this is a regression with multiple independent variables, in which case it must have the same number of rows or colunms of independent variables as known_x's. If you omit this argument, the function uses the specified or default values in known_x's. |
| [constant] | Optional. A logical value that determines whether or not a constant is to be included. The constant allows the regression line to intercept the Y axis at a point other than (0,0). Use True (the default value if this argument is omitted) to include the constant. Use False to force the line to intercept the Y axis at 0. |
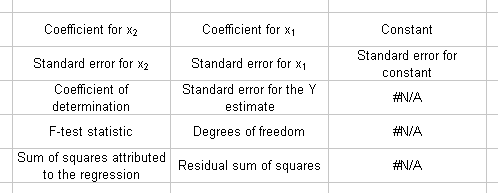
Results range Before entering this function, select a results range of the following size:
Results map This map shows how LOGEST fills the results range with data and statistics.

In the last three statistics rows, for results ranges wider than three columns, #N/A will appear in the third and subsequent columns. This is correct.
Coefficients The coefficients computed by LOGEST are displayed in the first row of the results range. For a multiple regression, the coefficients are displayed in the reverse order of the independent variables. (If your regression has 3 independent variables, the coefficient associated with the 1st variable is displayed in the 3rd column, the coefficient associated with the 2nd variable in the 2nd column, and the coefficient associated with the 3rd variable in the 1st column.)
The last cell of the first row of the results range displays the constant value, which will be 1 if constant is False.
Coefficients of 1 indicate either that there are not enough data points for the number of independent variables, or that some of the independent variables are too closely related.
Equation The regression computed by LOGEST attempts to fit the following formula:
![]()
where C is the coefficient, n is the number of independent variables, and b is the constant.
This formula can be converted to a linear form if logarithms are taken of both sides. The formula then becomes:
y = lC1x1+lC2x2+ ... + lCnXn+lb
This is the same formula fitted by the LINEST function. LOGEST uses LINEST internally to fit the linearized form of the equation. It then takes the LINEST coefficients (lC1, lC2 ,... lCn) and converts them to the LOGEST coefficients (C1, C2, ... Cn) by applying the EXP function: C1 = EXP(lC1). The same conversion is done with the constant, b.
Statistics If statistics is True, the results range displays the following statistics in the following locations. Please note that these statistics apply to the linearized form of the equation, as explained above.
| Standard Error Values | The error values correspond to the coefficients displayed directly above them. This is computed by dividing up the standard error for the Y estimate (see below) into components for each independent variable. It is an estimate of how much the errors in individual independent variable measurements contribute to the overall error. |
| Coefficient of determination | This statistic is similar in concept to the correlation coefficient computed by the RSQ function. It is a number between 0 and 1 that measures goodness of fit: low numbers indicate a poor fit, high numbers a good fit. |
| Standard error for the Y estimate |
This is computed by taking the square root of the residual sum of squares (see below) divided by the degrees of freedom (see below). |
| F-test statistic | This statistic can be used to do null hypothesis testing on the overall goodness of fit of the regression. |
| Degrees of Freedom | This is determined by subtracting the number of independent variables from the number of values in known_y's, less 1 if constant is True. |
| Sum of squares attributed to the regression |
This is determined by subtracting the residual sum of squares (below) from the total sum of squares of the differences between the values in known_y's and |
| Residual sum of squares | This is determined by summing the squares of the differences between the values in known_y's and the Y values computed by the formula you are trying to fit. It is a measure of the goodness of fit. |
Example This example of exponential regression uses the following data on the growth of the national debt of a small country.
| Year | National debt, in millions |
| 1971 | 0.5 |
| 1972 | 1.1 |
| 1973 | 1.4 |
| 1974 | 2.0 |
| 1975 | 4.4 |
| 1976 | 20.0 |
| 1977 | 445.0 |
In this case, the debt figures are the known_y's and we can use default values for the known_x's, since the years increment by one.
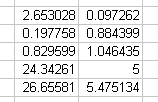
If the national debt figures fill range A2:A8, the function LOGEST(A2:A8,,TRUE,TRUE) returns the following results range:

See Also GROWTH, INTERCEPT, LINEST, SLOPE, TREND
