MATH 100 Quadratic Function Worksheet
Name:
Names of people you worked with:
The purpose of this exercise is to understand the "standard form" of a
quadratic function (p. 113) by relating it to the shifts and stretches
discussed in section 1.6 of the textbook.
Work in groups of two to fill in answers to the questions
below. Each group member should contribute equally.
A polynomial function of the form f(x) = ax2 + bx + c is
called a quadratic function. We already know that the
x-intercepts of a quadratic function are given by the quadratic
formula (or can be found by factoring). In this worksheet we learn
that the graph of any quadratic function is a parabola (p. 55 (e)).
As defined on p. 111 of your text, the axis of symmetry of a
parabola is the vertical line down its center; the parabola has mirror
symmetry across the line of the axis of symmetry. The vertex
is the point where the axis of symmetry intersects the parabola; it
represents either a maximum or minimum value of the quadratic function
whose graph is the parabola.
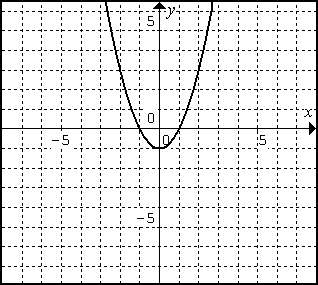
For instance, the quadratic function f(x) = x2 - 1 whose graph
is shown on the left below has the axis of symmetry x=0 and vertex (0,-1).
The quadratic function g(x) = x^2 whose graph is shown on page 55 of
your text has axis of symmetry x=0 and vertex (0,0). Since f(x) + 1 =
g(x), this should be no surprise; adding 1 to the output of f(x)
shifts the graph, and the vertex, upward by 1 unit. Similarly, if we
define a function h(x) = f(x-2) = (x-2)2 - 1 =
x2 - 4x + 3 will have the same graph as that of f(x) only
shifted 2 units to the right; its axis of symmetry will be x=2 and its
vertex will be at (2,-1). The graph of F(x) = 2(f(x)) =
2x2 - 2, shown on the right above, has the same axis of
symmetry as that of f(x). However, multiplying the output of f(x) by
2 has "stretched" the graph vertically so that the vertex of F(x) is
at (0,-2) and the parabola falls and rises more steeply.
Use reasoning similar to the examples given above and used in section
1.6 of your text to fill in the properties of the graphs of functions
in the table below. Use a graphing calculator or Graphmatica to check
your work.
| Function |
Vertex |
Opens up/down |
Stretched? |
| f1(x) = x2 |
|
|
|
| f2(x) = x2 + 3 |
|
|
|
| f3(x) = x2 + k |
|
|
|
| g1(x) = (x - 2)2 |
|
|
|
| g2(x) = (x - 2)2 + 3 |
|
|
|
| g3(x) = (x - h)2 |
|
|
|
| g4(x) = (x - h)2 + k |
|
|
|
| g4(x) = (x - h)2 + k |
|
|
|
| f4(x) = -x2 |
|
|
|
| f5(x) = 42 |
|
|
|
| f6(x) = 4(x - 2)2 + 3 |
|
|
|
| f7(x) = -4(x - 2)2 + 3 |
|
|
|
| f8(x) = a(x - h)2 + k |
|
|
|
| |
|
|
|
As seen on page 113, f(x) = a(x - h)2 + k (where a is not
0) is the standard form for the equation of a quadratic
function. All quadratic functions can be written in this form (you
may prove this statement for extra credit!)
- What is the equation of the axis of symmetry of the graph of f(x)
= a(x - h)2 + k?
- What are the coordinates of the vertex of the graph of f(x) = a(x
- h)2 + k?
- The graph of f(x) = a(x - h)2 + k is a parabola; when
will this parabola open up? When will it open downward?
- When will the graph of f(x) = a(x - h)2 + k have the
same shape as graph (e) on page 55 and when will it be "stretched"?