MATH100: Exploring Exponential Functions
Name:
Names of people you worked with:
The purpose of this exercise is to generate data on exponential growth
and decay and to find equations that describe that data. Please work
in pairs to collect your data; you may combine into larger groups to
work on the later portion of the worksheet.
To complete this worksheet you will need approximately 50 M&M's, pennies, or other
two-sided objects.
Population Growth (20 pts)
In this exercise you will observe the growth of a population of M&M's.
These M&M's live in a perfect habitat: they never age or die, and in
every generation each M&M has a 50% chance of producing a child M&M.
Please do not eat the M&M's -- you will need them for the second
activity.
| Generation |
0 |
1 |
2 |
3 |
4 |
5 |
6 |
7 |
| No. of M&M's |
4 |
|
|
|
|
|
|
|
You start with a population of 4 M&M's. Place 4 M&M's in a cup and
shake the cup gently, then carefully pour the M&M's onto a paper plate.
Count the number of M&M's on the plate that have an M showing. Add
one M&M to the cup for every M you see. These M&M's simulate the
children of the M-side-up M&M's. Return the 'adult' M&M's (the ones on the
plate) to the cup and record the total number of M&M's now in the cup.
Repeat the process described above until you run out of M&M's. At
that point, record the number of M&M's you would have needed to have in
the cup to continue.
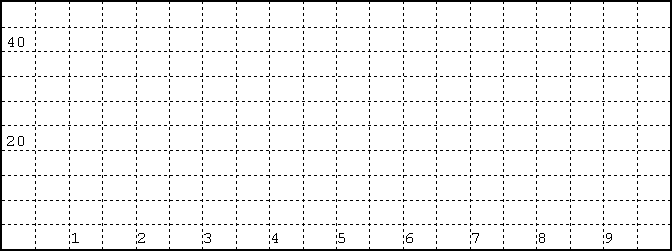
Plot your population sizes on the chart below.

Endangered Species (20 pts)
Not all M&M's are fortunate enough to live in a perfect habitat. You
will now study the population of a community of M&M's whose size
is shrinking rapidly!
| Generation |
0 |
1 |
2 |
3 |
4 |
5 |
6 |
7 |
8 |
9 |
| No. of M&M's |
|
|
|
|
|
|
|
|
|
|
Count your M&M's and place them in the cup. Record the initial
number of M&M's as the population of Generation 0 in the table above.
Shake the cup and pour the M&M's onto the paper plate. M&M's that
have an M showing survive -- count them, record the new population size, and
put them back into the cup. The M&M's with no M showing are not so
lucky. Dispose of their little chocolatey corpses as you see fit.
Repeat the process until your M&M's are extinct. Plot your
population data in the chart below.

Making A Mathematical Model (60 pts)
If M&M's are allowed to reproduce unhindered in an ideal environment, how long
will it take for them to overrun the planet? How long would it take a brave M&M extermination
team to eliminate this threat to our waistlines?
Follow the instructions on the next page to find mathematical models for the
sizes of the populations you studied. You may assume there's a 50% or 1 in 2
chance of an M&M landing M up.
- M&M population in an ideal environment:
- If you have p=4 M&M's in your cup, about how many M&M's will land
M-side up when you pour them out?
- If all of these M-side up M&M's "reproduce", about how many
M&M's will you have in your cup after you add the child M&M's?
q=______
- What multiple of your original population p=4 is q? Check your work using a calculator.
p x ______ = q
- In an ideal environment, M&M population is (approximately) multiplied by ______ in each generation.
- Write an equation describing the M&M population in generation n if the population is 4
in generation 0. You may wish to refer to your answer to the previous problem
and use chart at the top of page 383 of your textbook. If you use some
other method of finding your answer (e.g. if you fit a curve to your data)
please explain how you got your answer.
- What population does your equation predict for generation 3? (Plug 3 into your equation.)
- How many M&M's did you have in generation 3 in your experiment? (You can get this number from the table
on page one of this worksheet.)
- Does the predicted population in generation 3 match the actual population? Why or why not?
- Model of endangered M&M population:
- If there are p=60 M&M's in generation 0 and only M-side-up M&M's survive, approximately how
many M&M's (q) will there be in the next generation?
q = ______
- In a hostile environment, M&M population is (approximately) multiplied by ______
in each generation. (I.e. p x _____ = q.)
- Write an equation describing the M&M population in generation n using your starting population
from page 2.
- What population does your equation predict for generation 3? Does this match your observations?
-
Professor Burgiel left a packet of 25 M&M's on her desk. Suppose
Prof. Burgiel's office is an ideal environment for an M&M population.
How many generations of reproduction will it take before she has over
50 M&M's on her desk? Over 100? Over 1000? (Please show your work!)
Bonus (5 pts) Suppose each M&M covers approximately 1
cm² of area and that the area of Professor Burgiel's office is 135,000
cm² = 13.5 m². How many generations of M&M
reproduction will it take to completely cover her office? (You may turn in
your answer on a separate page.)


