HallOpt
HallOpt is a simple yet powerful tool for
determining the first order properties of efficient biologically inspired
flight and swimming. The tool is used to
determine how an efficient flapping wing locomotive system should generate the
unsteady forces during the flapping cycle. HallOpt is based on the wake only analysis approach presented by Hall et
al [1][2][3].
It is particularly well suited
to flapping flight analysis due to the wake only nature of the model. The
geometric details of the wings and the body during flapping are not needed at
this low fidelity stage, which significantly simplifies the analysis procedure.
The HallOpt method can be used in both 2-Dimensions
and 3-Dimensions.
The HallOpt approach follows the steps below which are also presented in
figure 1:
1.
Prescribe the wake shape: The wake shape can be
approximated as the trace of the trailing edge of the flapping wing/foil.
2.
The unknown wake vorticity/circulation
distribution is assumed to lie on this approximate wake surface and is
approximated using a streamwise periodic vortex
lattice.
3.
The unknown wake vorticity/circulation
distribution is determined by minimizing the induced power subject to lift,
drag and side force constraints.
4.
The resulting vorticity/circulation
distribution represents the minimum power wake for that particular flapping
configuration.
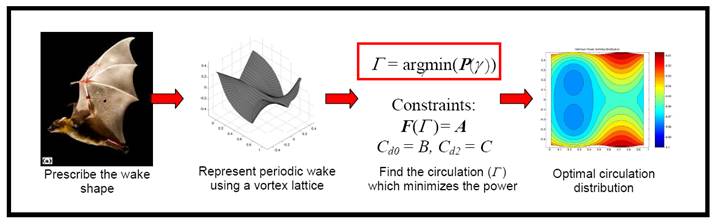
Figure 1: An
illustration of the HallOpt process. From left to right, we can see (1) the bat
generates a vortex wake from the lifting surfaces during the flight
motions. In (2) this vortex wake is
represented using a vortex lattice method. The vorticity
in the wake can be directly related to the induced power and forces generated
by the flying animal. From the expressions the minimum power wake can be
computed.
Understanding the HallOpt Wake
Result
The wake in Figure 2 is
an illustration of a particular solution of the minimum power wake using HallOpt. In this
image, a top down view of the wake surface trailing the bird is assumed. The
flight direction is from left to right, starting with a downstroke.vIn
order to understand this wake, we examine the
circulation and vorticity distribution. Consider the
wake in the upper-left figure below. The shades of color represent the wake
circulation (blue being larger circulation, red being reduced circulation). The
constant contours of the circulation in the wake represent the vorticity or vortex filaments. As can be seen, there is a
large shed circulation in the wake during the downstroke
(thereby producing lift and positive thrust), while the upstroke shows the
alleviation of the loading in the wingtip regions. The upstroke here is active,
and as a result the vorticity distribution exhibits a
ladder like structure for this particular kinematics and lift/thrust
requirement.
The remaining figures
illustrate how this wake might be generated by a simple rigid wing with a
leading edge torsion spring. By observing this required pitching motion, one
can see that a passive structural behavior can likely generate much of the
optimal wake vorticity leaving the fine tuning to be
done by active wing adjustments.
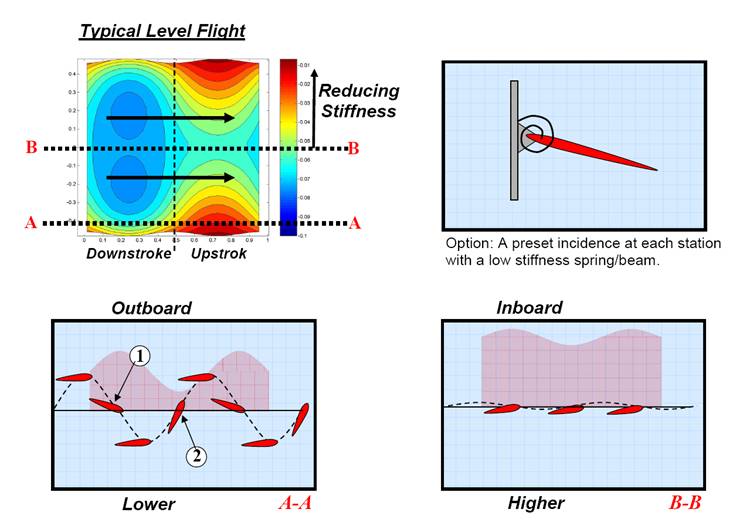
Figure 2: In this figure we present
an illustration of the design of a flapping vehicle based on a
optimal 3-D wake profile.
Example using HallOpt: Strouhal Number Effects
In [6] it was shown that
nature tends to exploit a reverse Karman vortex wake
structure at a Strouhal number between St =
0.2-0.4. In addition, Triantifylou et al [7] have also illustrated significant
increase in propulsive efficiency within this Strouhal
Number range. In order to gain insight into the choice of flapping parameters
(amplitude and frequency) and fluid dominated parameters (such as the drag
polar), we present a design space sweep of these
parameters using the HallOpt method in Figure 3.
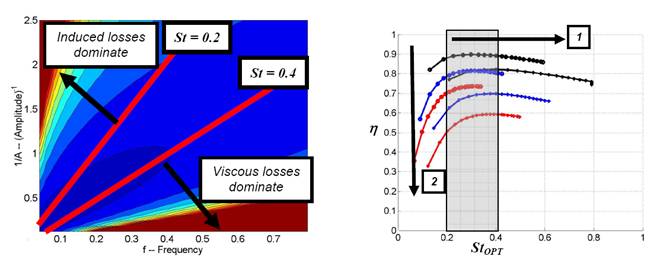
Figure 3: In this illustration the
effects of Strouhal Number in a 2-dimensional
simulation are examined. The results on the left indicate the minimum power variation
with respect to frequency and amplitude of the heaving airfoil. In this case
the blue represents a lower minimum power while the red represents a higher
minimum power. One can see in the left image that for the particular drag polar
and thrust requirement examined the optimal Strouhal
number at which minimum energy propulsion is achieved is within the range
exploited by nature and predicted by previous experiments [7][8]. As can also
be seen, the plot, lower Strouhal numbers are
penalized with a higher induced drag, while the higher Strouhal
numbers are penalized by viscous losses. In the figure on the right, we plot
the maximum propulsive efficiency for a given thrust requirement as a function
of Strouhal number. Each of the lines represents a
single given drag polar, while the variation in the line from left to right is
due to an increasing thrust requirement. The interesting feature here is that
the maximum efficiency lies at within the expected Strouhal
number range and is only mildly dependent on the drag polar (the different
lines are vastly different drag polars).
Parametric Studies using HallOpt
We have also used the HallOpt code to examine parametric motions parameters.
These studies can be found in [9]. In the figure below, we show the incorporation
of a forward-aft degree of flapping freedom in addition to the baseline up-down
flapping motions. As can be seen, there is an effective reduction in power
consumption due to the presence of the additional degree of freedom. In effect
the forward aft motions in this case allow the wake to have a larger downstroke area and therefore a larger momentum disk from
which to extract forces.
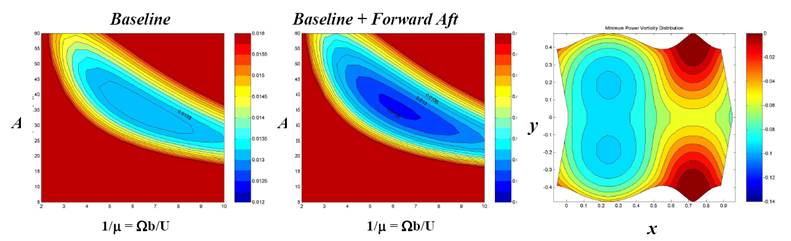
Figure 4: A plot of the amplitude vs. non-dimensional frequency
for a baseline (up-down) motion (left), a baseline + forward aft motions
(middle), and a plot of the resulting optimal wake for this particular
simulation (right).
References
- Hall,
K.C., Piggott, S.A., Hall, S.R., Power Requirements for Large Amplitude
Flapping Flight, Journal of Aircraft, Vol 35, #
3, 1998.
- Hall, K. C., and Pigott, S. A., "Power Requirements for
Large-Amplitude Flapping Flight," AIAA Paper 97-0827, Presented at
the 35th Aerospace Sciences Meeting and Exhibit,
- Hall,
and K.C Hall, S.R., Minimum induced power requirements for flapping
flight, J. Fluid Mech. Vol. 323, pp 285-315, 1996.
- Trefftz Plane (Ilan
Kroo, Desktop Aeronautics, Info. at, http://www.desktopaero.com/appliedaero/potential3d/InducedDrag.html)
- Betz,
A. Schraubenpropeller mit
geringstem Energieverlust,
Vier Abhandlungen zur Hydrodynamik und Aerodynamik, pp. 68-92, 1927.
- Graham K. Taylor, Robert L. Nudds, Adrian L. R. Thomas, Flying and swimming animals cruise at a Strouhal
number tuned for high power efficiency, Nature 425,
707–711, October 16, 2003.
- Triantafyllou,
M.S., Triantafyllou, G.S. and Gopalkrishnan, R. (1991). Wake mechanics for thrust
generation in oscillating foils. Phys. Fluids A. 3,
2835-37.
- Triantafyllou,
G.S., Triantafyllou, M.S. and Grosenbaugh, M.A.. (1993).
Optimal thrust development in oscillating foils with application to fish
propulsion. J. Fluids Struct. 7, 205-24.
- D.J.WILLIS, J.PERAIRE, M.DRELA,
and J.K.WHITE, 'A numerical
exploration of parameter dependence in power optimal flapping flight',
presented at AIAA Conference, AIAA 2006-2994,